Blog

April 9, 2015

Choc full of information

Dark chocolate.jpg
Chocolate is a complex structure containing consisting of cocoa powder, sugar, fat solids (primarily cocoa butter). The cocoa powder and cocoa butter both come from the cocoa bean following roasting, grinding, and liquification. The flavor and mouth feel of chocolate will depend on the ratios of these components, as well as their size and structure. For the cocoa butter alone, there are six different crystalline structures that it can assume depending on its processing, which will impact how shiny the finished product is, how it melts in your mouth, and if it will undergo blooming, the development of a gray coating on some inferior brands of chocolate.

Cambridge Polymer Group analyzed multiple types of chocolates, looking at their chemistry, morphology, rheology, and mechanical behavior.  Alkaloid content, primarily caffeine and theobromine, was analyzed with chromatographic techniques, along with microstructural information by scanning electron microscopy.

The full application note can be found here.

Posted by CatherineCerasuolo
0 Comments
April 3, 2015

Bubble Point for Pore Size Measurements

Bubbles.jpeg

The pore size in filters, membranes, and fabrics can be determined at Cambridge Polymer Group by a variety of methods, including optical and scanning electron microscopy, mercury porosimetry, and particle size exclusion. A commonly used method is ASTM F316 "Pore size characteristics of membrane filters by bubble point and mean flow pore test." This standard describes two test methods to obtain pore size in filtration media by making use of gas transmission through the filtration media. In both methods, the filtration media (in the form of a sheet) is cut into a disc, which is then placed in a filter holder. One side of the filter holder is connected to a gas line with a pressure regulator. The other side is vented to the atmosphere. In Method A, a fluid of known surface tension is placed on top of the filtration media on the vented side. The gas pressure on the other side of the filtration media is slowly increased, and the experimenter looks for the lowest pressure where gas bubbles begin to rise from the filter, indicating that the gas pressure has overcome the interfacial tension of the liquid in the pores. The maximum pore size can be calculated from this pressure and the surface tension of the fluid. In Method B, the same apparatus is used, but with the addition of a gas flow meter. In this variation, the gas pressure is also slowly increased, and the flow rates of gas through both a wet filter (using the fluid of known surface tension) and a dry filter are recorded.  The percentage of filter flow rate can then be determined as a function of pressure, which in turn is related to the pore size.

Contact CPG for more information on performing this test on your filtration media.

Posted by CatherineCerasuolo
0 Comments
March 16, 2015

MIT Polymer Symposium

2015-03-mit-polymer-symposium-1.jpg


2015-03-mit-polymer-symposium-2.jpg


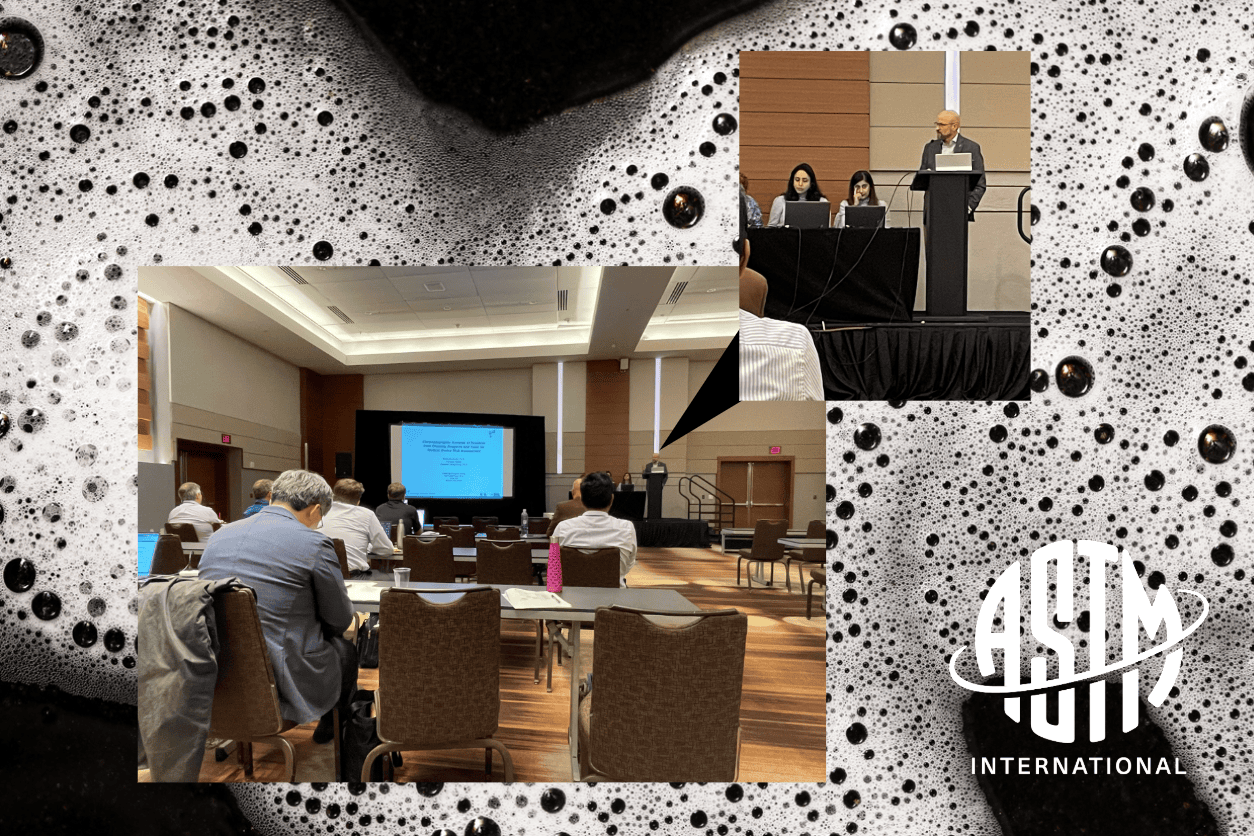
CPG was a sponsor of MIT's 5th annual Polymer Day Symposium, held on March 11, 2015 at MIT. The event is hosted by MIT's Program in Polymers and Soft Matter. A poster session was held in the morning, and two CPG scientists, Svirkin and Kozak, acted as judges, and awarded prizes to the top posters. More information on the Symposium can be found here.

Posted by admin
0 Comments
January 28, 2015

How to determine if your medical devices are clean

Sterile medical products.jpeg


The success of a medical device depends on both the details of its design and the proper selection of materials from which it is fabricated, taking in to account its final use and regulatory requirements. Success also depends on how it is manufactured, and a critical feature of medical device manufacturing is ensuring a suitably clean product. Cleaning is almost always performed in the final stages of manufacturing, but some manufacturing processes may include intermediate cleaning steps.

To ensure that the cleaning process is doing its job, manufacturers will perform cleanliness measurements on their devices to determine how much manufacturing residue remains on the part, and the nature of that manufacturing residue. Simply quantifying the presence of residues is not sufficient however, because this does not account for how sensitive the design is to that residue.  For example, residual sodium chloride may be acceptable at gram quantities, whereas arsenic may not be acceptable at any level. A critical step in clean-line validation that is often missed is therefore to assess what is an allowable amount of residue while still ensuring a good clinical outcome of the device.  Often this involves are considered cost-benefit analysis between the effort to clean, and the risk associated with that residue.

Cleanliness measurements are either performed by removing the residue from the part and quantifying the residue with various analytical assays, or by measuring the residue in situ on the part. The latter technique is less suitable for quantification measurements, but is useful for identifying where on the part the residue is residing, which may assist in modifying either the cleaning process or the part design. Cleanliness measurements include residue weighing, FTIR, GC and LC/MS, ICP, UV-Vis, and SEM-EDS to quantify and identify sources of residue.

To assess what levels of residues may remain on the part without impacting the clinical performance, manufacturers often look at devices on the market already in the same application area with good clinical history, and measure their residue levels. These levels can serve as guidance for establishing acceptable manufacturing residues. Alternatively, toxicological studies can be carried out, or  some animal studies.

The manufacturers clean-line can then be validated using the cleaning assays discussed above, along with the allowable residue levels the manufacturer previously determined. To validate a clean-line, a representative number of devices are tested under normal operating conditions as well as the extremes of the operating conditions, to see if the process is in control.

ASTM offers several standards for testing the cleanliness of medical devices, and new standards are being developed for clean-line validation and establishing allowable residue levels. Cambridge Polymer Group performs these standards for clients, and assists with clean-line validation.


Case studies on medical device cleanliness can be found here.

Posted by CatherineCerasuolo
0 Comments
January 8, 2015

Using free radicals to monitor engine oil age

Motor oil.jpg


Car owners are advised to change their engine oil every 3000-5000 miles. But what is actually happening to the oil over time in the engine? We have heard about the benefits of antioxidants in the body. Antioxidants also help engine oil. In use, engine oil is subjected to high temperatures and high shear stresses which can act to break apart the oil molecules, affecting its viscosity and performance. This chemical reaction occurs through the generation of free radicals, or unpaired electrons on the oil molecules. By monitoring the free radical content, it is possible to monitor the change in the oil.

CPG used electron spin resonance spectroscopy to monitor the change in oil in a 6 cylinder gasoline engine, taking samples every 500-1300 miles. Free radical production started around 400 miles, and changed as the free radicals were either stabilized by the antioxidant package in the oil, or reacted to form other radical species. This method is useful for monitoring the chemical changes in the oil, and to see the efficacy of the additives package.

Read the application note for more details.

Posted by CatherineCerasuolo
0 Comments
December 12, 2014

The Rheology of Beer

Beerfoam.jpg
Princeton scientists Alban Sauret, Francois Boulonge, Emilie Dressaire, and Howard Stone have applied fluid dynamics and rheology to help long-suffering beer drinkers understand why beer with a head of foam are less likely to slosh and spill compared to their counterparts with less foam. Simple experiments, like the images shown above, indicate that reducing the thickness of the head of foam increases the sloshing potential when the glass is agitated. Stone and colleagues modeled this behavior, and demonstrated that the foam in beer dampens the sloshing effect of the beer through viscous dissipation. The viscous force scales with the Capillary number, which relates the relative contributions of surface tension and viscosity. The viscosity of the foam is related to the velocity of the bubbles in the foam. The foam dissipates the energy of sloshing to the walls of the glass. Stone and colleagues suggest this is why it is easier to carry a glass of beer versus a cup of coffee without sloshing, although the study would suggest that cappuccinos may be recommended for those on the go.

Posted by CatherineCerasuolo
0 Comments
October 30, 2014

Swedish warships and quality management systems

Vasa.jpeg

In the design of a new device, a good manufacturer will follow quality management principles to ensure the device meets the requirements of the end-user. What does this have to do with Swedish warships? History can provide us with useful lessons on quality management systems. The Vasa was a warship built in 1626 that holds the unfortunate reputation of sinking on her maiden voyage after sailing less than a mile. From a modern perspective, the construction and launch of the Vasa suffered from one primary problem.  The lack of a quality management system during her design meant that a good design team was not assembled and new design concepts were not adequately tested and verified during construction. As a result, design changes were instituted “on the fly” after the nominal design freeze, and contradicting results from final verification tests were ignored, or never reached the right people. As a consequence, she was unable to meet the specifications required to be sea-worthy, and sank quickly when a gust of wind hit her when leaving Stockholm's harbor an incorrect weight balance resulting from overly complex superstructure. An adequate quality management system might have provided the checks and balances and gating necessary to any good design process, perhaps avoiding her sinking.

As an aside of a more polymeric nature, she was raised piece by piece from the sea floor in 1961, and currently sits in a museum in Stockholm, where she is in surprisingly good shape. She is being impregnated with polyethylene glycol as a preservative, although recent studies are suggesting that PEG application to wood in an acidic environment (the Vasa was in acidic water for centuries) will form formic acid, which could damage the wood.


Download full application note

Posted by CatherineCerasuolo
0 Comments